From Founder and President Rebekah Morris down through the entire Research, Editorial and Support staff, the crew at BEX Companies proudly self-identifies as “Data Geeks”. The annual Construction Activity Forecast Event is our time to shine and show off the extreme (some might even say excessive) volume of data we’ve put together over the year and compare it to the previous year’s output and result.
For our 2023 event(s), 365 attendees registered to drink from the data firehose and soak up as much information as they could in a whirlwind two-hour presentation by Morris and DATABEX Manager Lya Parrish. For the first time, demand was so heavy the event had to be presented twice to accommodate everyone who wanted to come.
Following brief introductory remarks from Parrish explaining how data for the 11 covered markets is collected and analyzed, it was off to the races with Morris’ now-familiar overview of the state of the overall Arizona construction market, its impacts and what has changed over the last 12 months.
State of the Market
Morris started her annual summary noting the three major factors impacting construction in the state—Population Growth, Employment, and Inflation and Interest Rates—the last of which she noted had not been a major factor until 2022.
Population growth has been a primary factor in Arizona since the end of the Great Recession, trending generally upward over the past 10 years and hovering around 1.5% annually.
That has, of course, fueled demand across the range of construction markets. Ironically, what it has not done is return construction employment to its pre-Recession levels. At its peak in 2006, Arizona construction employment was 240,300 jobs. That plummeted in the recession down to 110,900. Even with the exceptional boom in project counts and valuations, however, by 2022 construction employment had only rebounded to 186,700.
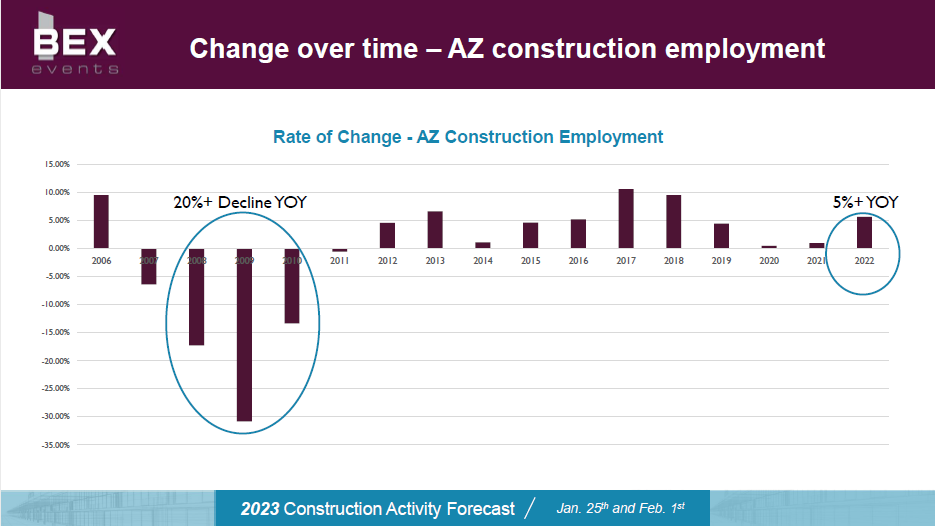
Even with a workforce that’s 22.3% below its former peak, however, 2022 construction activity totaled $22.4B, a 24% year-over-year increase and a $730M increase over the 2006 past peak.
On the inflation side, a combination of supply issues and cost increases held market growth back in 2021, Morris said. “Construction was constrained in Arizona. We couldn’t get materials, couldn’t get labor. There were, and there are still, some significant permitting delays. We did not grow the industry, but we certainly grew our Producer Price Index, that inflation number,” which hit 10%. The PPI for 2022 came down to approximately 6.7%.
Construction activity, however, grew by 24%. “I don’t have a precise answer on, ‘How much did inflation grow versus how much did the market grow?’ What we know is that we grew jobs. We’ve got specific counts by market sector. We have very specific project-level detail. We can tell the overall market grew much more than inflation.”
After going over the general numbers, Morris put the data into context across construction markets. She reported that in 2019, the cost/SF for a small office renovation was between $50 and $100. In 2022, that had risen to $150-$250. For new mid-sized apartment complexes, the cost/SF was $150-$175/SF. In 2022 the average was between $220-$275.
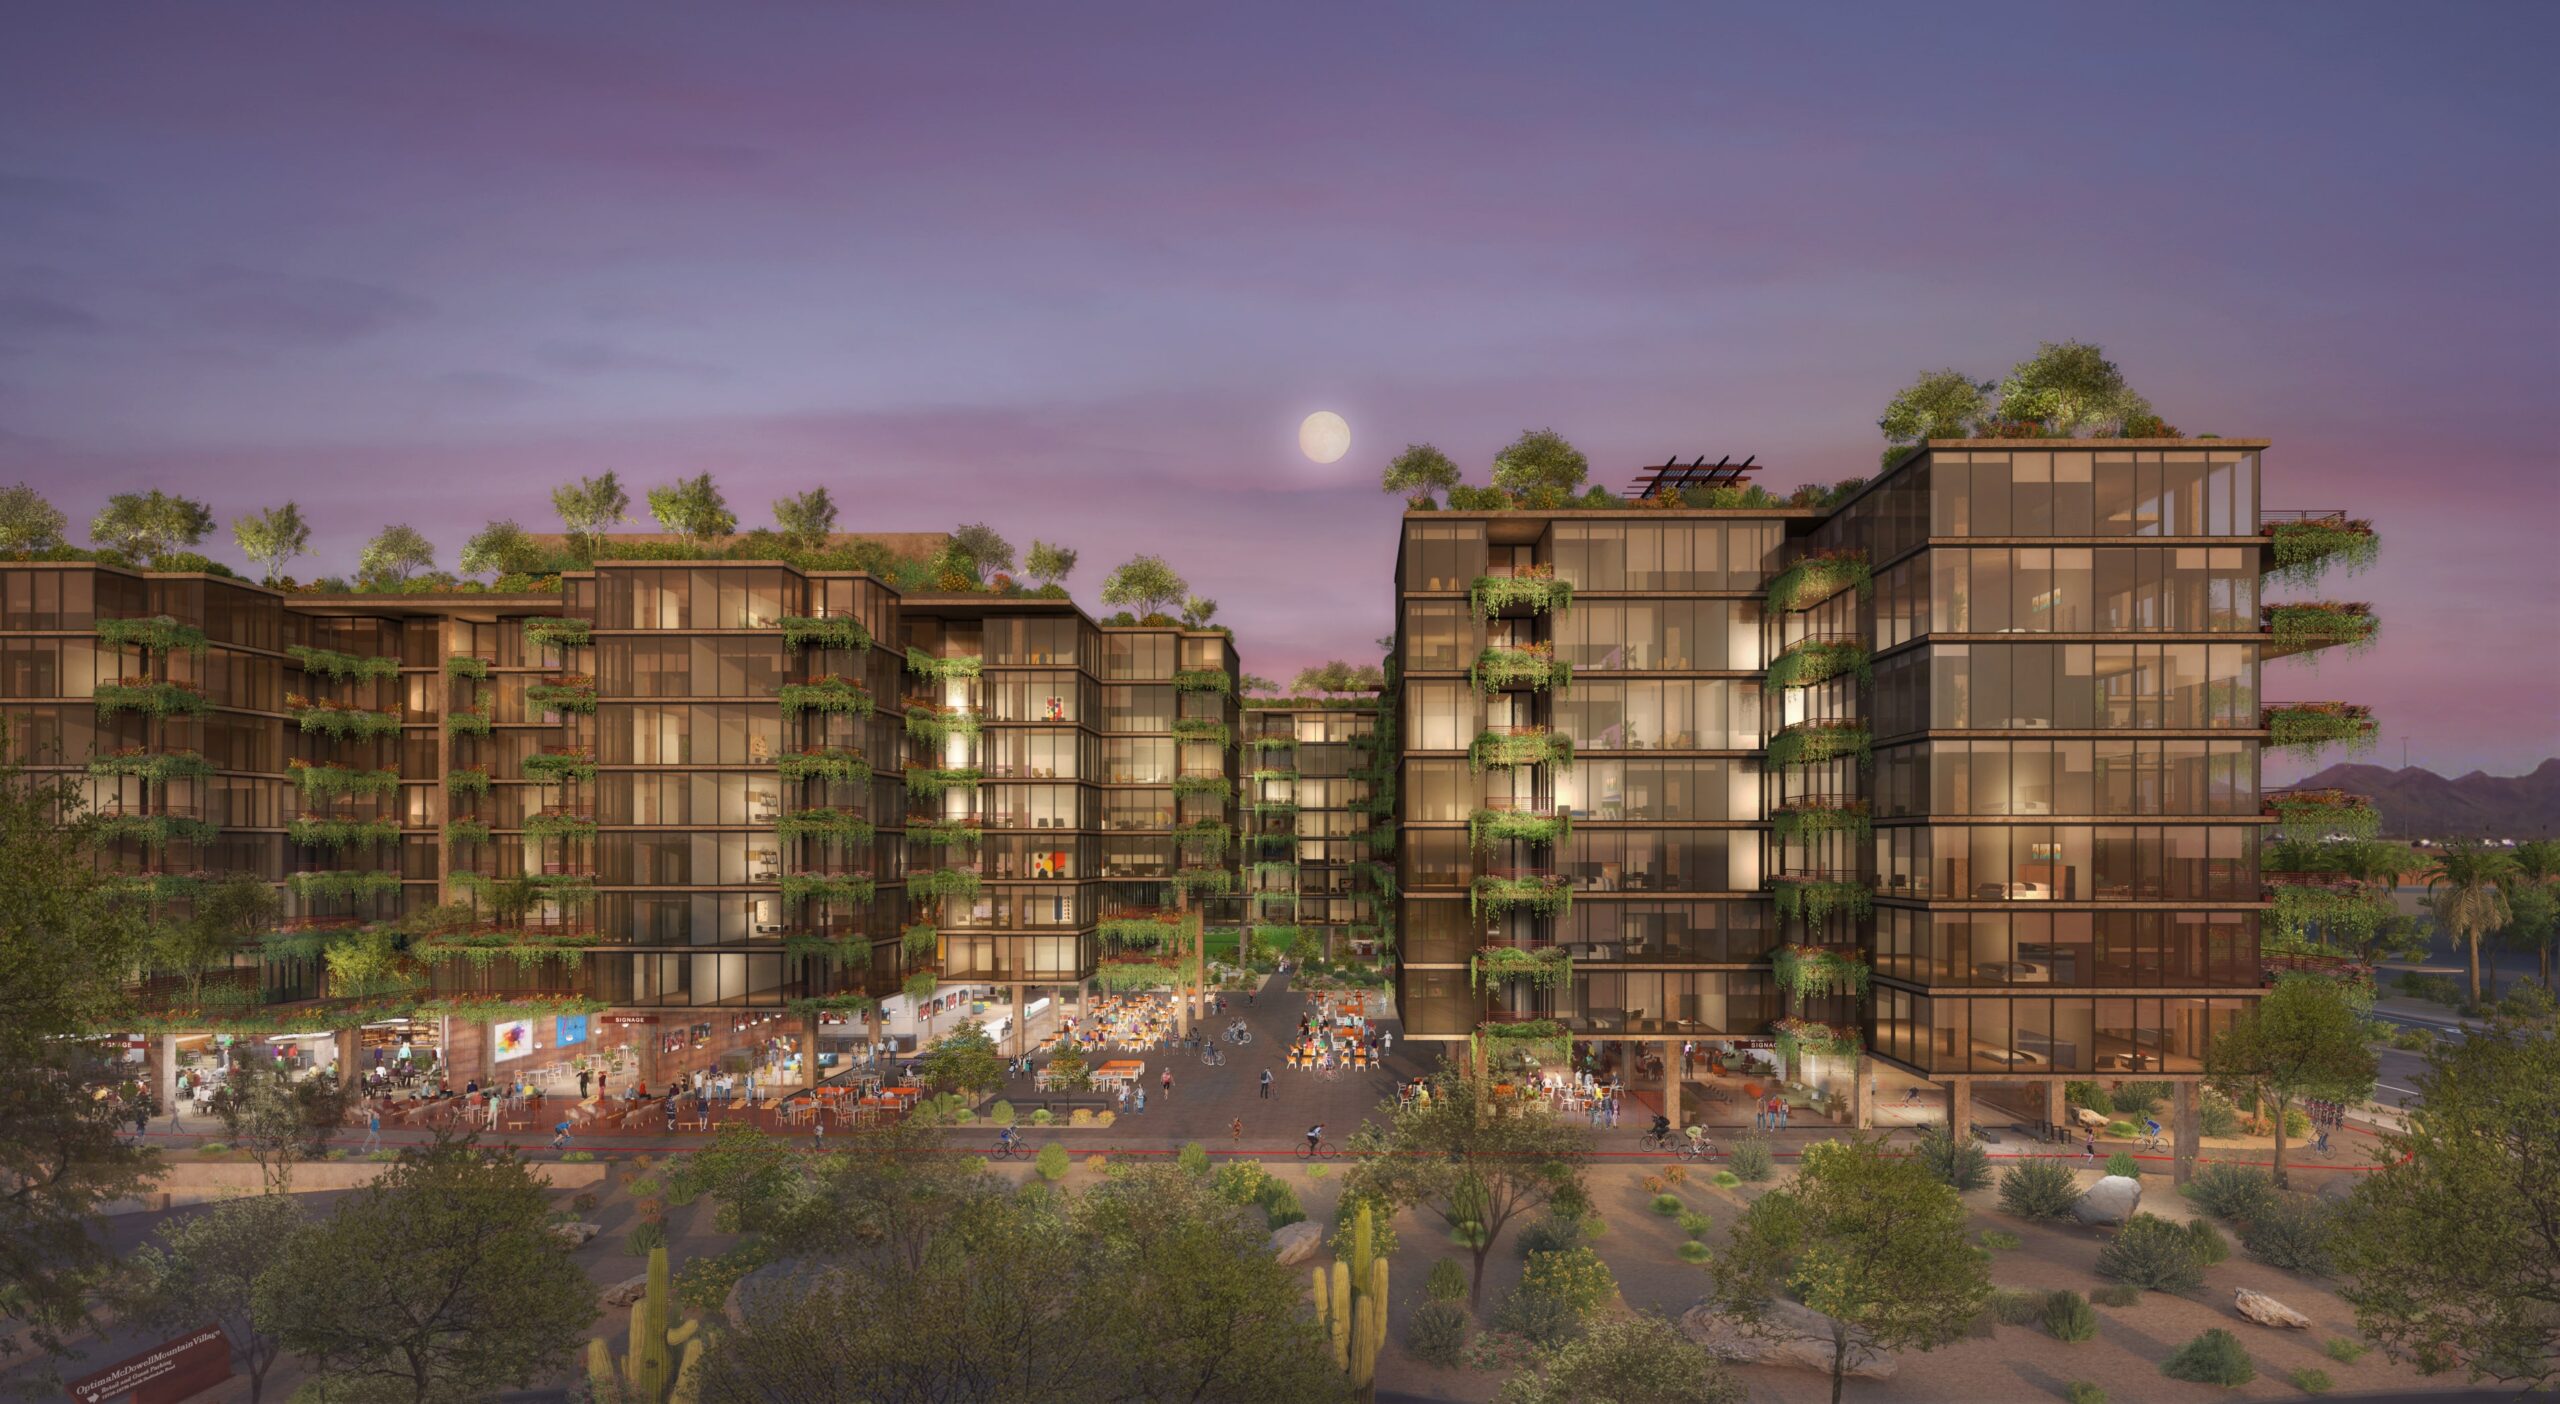
The researchers and the audience were fortunate enough to have an apples-to-apples comparison for high-end multifamily. In 2020, the Optima Kierland luxury apartment development was announced with a per-unit cost estimate of $632K. For the Optima McDowell Mountain Village project announced in 2022, the per-unit development cost had risen to $751K.
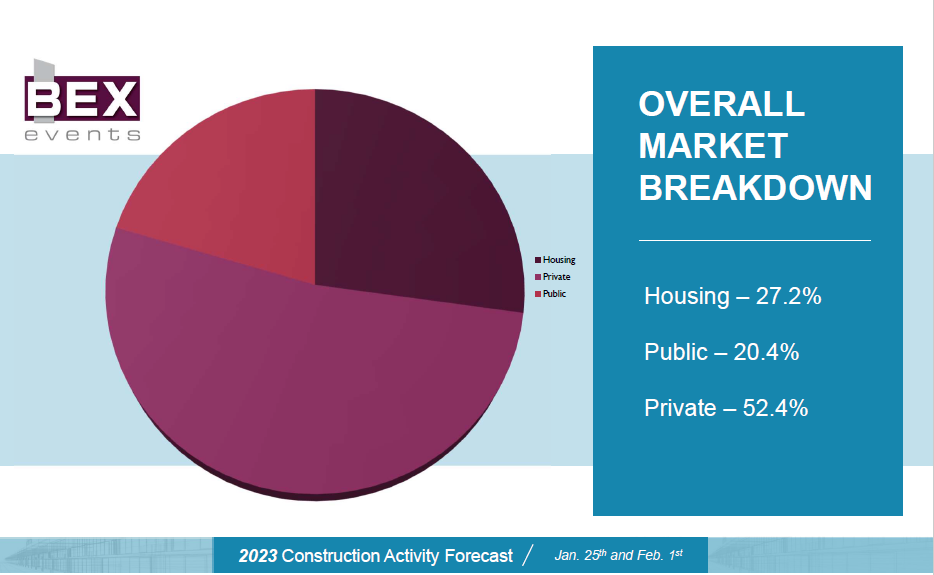
Nearing the end of her introductory segment, Morris talked about how, not very many years ago, the market share breakdown between Housing, Public and Private projects was generally one-third to one-third to one-third. Showing a seismic shift in demand volumes, Housing currently stands at 27.2%, Public at 20.4% and Private at a whopping 52.4%.
Capital Improvement Programs
Morris next launched into coverage of projects and trends in Capital Improvement Programs and the Public sector, which for research purposes consist of Education, Public Spaces, Utilities and Transportation.
Of the Top 10 Capital Improvement Programs analyzed this year, only two—Valley Metro and Mesa—showed decreases. Phoenix led with $9.778B, followed by the Arizona Department of Transportation at $6.752B.
Bringing up the rear at Number 10 was the Town of Queen Creek, which saw its CIP explode with a 232.1% increase to reach $972.3M.
Read more on AZBEX
Visit Optima McDowell Mountain Village for more details
Visit Optima Kierland Apartments for more details